EOTPR QuickSim
Simulation Tool
The EOTPR QuickSim is a simulation tool for EOTPR users which can ease the interpretation of the EOTPR waveforms. This is a software package that can quickly and accurately simulate the EOTPR waveform recorded from a known good device sample measurement.
The software requires only limited DUT (Device Under Test) information to generate an accurate model (e.g. trace length) and does not require the full 3D design file of the DUT.
Once generated and optimised, models can be used to accurately locate faults in a failed device.
Simulation Steps
• Import measured EOTPR waveforms
• Construct circuit model of device (typically < 5 minutes)
• Perform optimisation (typically < 1 minute)
• Extract fault location
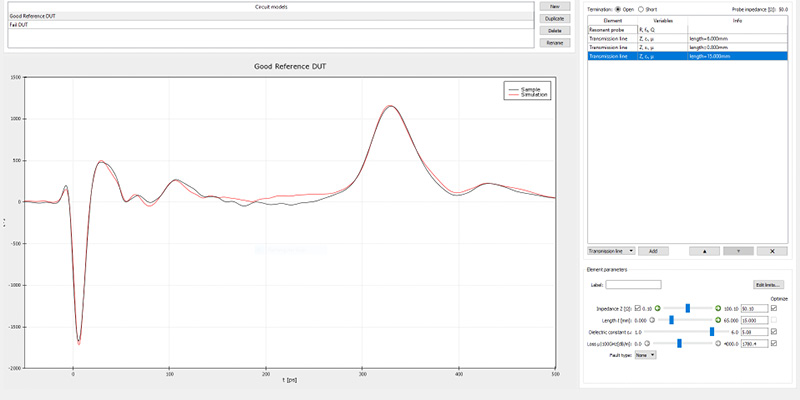 The example above shows the EOTPR QuickSim simulation of a bare substrate.
Good fit is obtained between the measured (black curve) and simulated (red curve) waveforms.
The example above shows the EOTPR QuickSim simulation of a bare substrate.
Good fit is obtained between the measured (black curve) and simulated (red curve) waveforms.
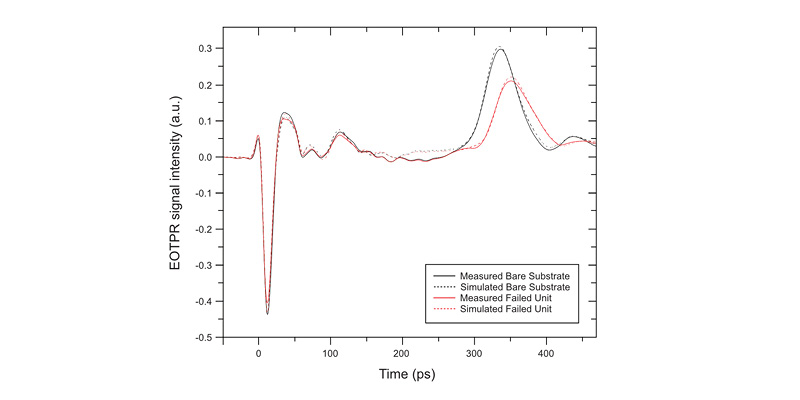
The figure above shows the measured and simulated waveforms for two 2.5D devices. EOTPR QuickSim was the used to generate a circuit model of a bare substrate waveform (solid black curve). The resultant simulated bare substrate waveform is shown by the dashed black curve in the figure. The different features of the measured waveform are reproduced well in the simulated model. The optimized bare substrate model was then used to find the best fit to the measured failed unit waveform (red solid and dashed curves). The model puts the fault 100 µm after the bare substrate termination, in good agreement with the confirmed fault location.
The software requires only limited DUT (Device Under Test) information to generate an accurate model (e.g. trace length) and does not require the full 3D design file of the DUT.
Once generated and optimised, models can be used to accurately locate faults in a failed device.
The example above shows the EOTPR QuickSim simulation of a bare substrate.
Good fit is obtained between the measured (black curve) and simulated (red curve) waveforms. The figure above shows the measured and simulated waveforms for two 2.5D devices. EOTPR QuickSim was the used to generate a circuit model of a bare substrate waveform (solid black curve). The resultant simulated bare substrate waveform is shown by the dashed black curve in the figure. The different features of the measured waveform are reproduced well in the simulated model. The optimized bare substrate model was then used to find the best fit to the measured failed unit waveform (red solid and dashed curves). The model puts the fault 100 µm after the bare substrate termination, in good agreement with the confirmed fault location.

